
Regardless of the goal you’re trying to achieve, data-driven problem solving can be the key to success. Operations is more than making a plan and managing the team. Operations should also involve strategic use of data, and using data well makes managing teams and timelines less painful because you’ll be able to hit your goals with less work (and maybe even fewer people).
Funnels are your friend
Many processes in business and in nonprofit endeavors can be thought of in terms of funnels. The one you’ll hear the most about is the sales funnel—but there’s also the recruiting/hiring funnel, the admissions funnel, the generic increasing-the-rate-of-a-desired-thing funnel, and many others. Funnels are most helpful when analyzing a process where you can measure a success rate or progression rate at each stage in a multi-step process and where the process typically only narrows at each stage.
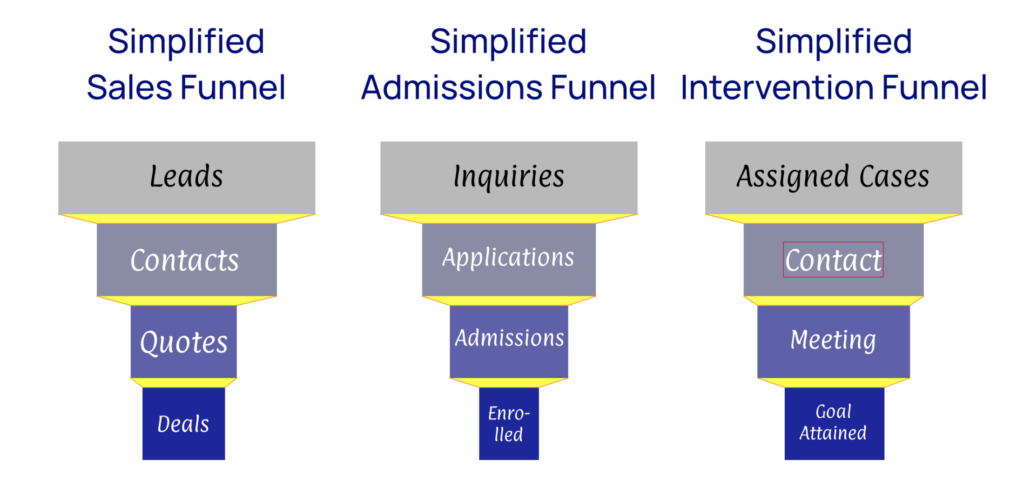
In each of the simplified example funnels above, think of the width of a funnel at a given stage as the count of the number of people/entities/items still in the process at that stage in the funnel. Then between each stage, illustrated in yellow above, there’s some sort of potential narrowing of the funnel—the narrowing being driven by those that didn’t progress. Not every sales lead wants to talk. Not everyone you talk to wants a quote. Not every student you offer admission to ultimately enrolls. A funnel shows the quantities at each stage in the process as well as the extent to which the funnel narrows at each stage in the process. Funnels also help us by defining success in advance (the bottom stage in the funnel) and focusing us on analyzing each other step in the process in terms of how it affects the final desired outcome.
Let’s talk math & strategy briefly
To think about the math of funnels, consider this scenario: you are the admissions director for a school. This school could be a K12 charter, a K12 district competing with local charters, a college, a university, or a training program of any sort. Last year, you had 3,000 contacts in your database who either indicated interest or were recommended by someone. Of these, 900 applied, and you admitted 600 total. This year your goal is to admit 800, or an increase of 1/3 on the prior year. What are your approaches to hitting your goal? Mathematically speaking you have two general ways to approach this:
- Make the top of your funnel bigger: in this case, we’re going to need more than 3,000 contacts in the database to be emailing, texting, and reaching out to—and we are going to hope that the progression rates within the funnel stay the same as in prior years. If you assume everything else stays the same and you assume that the “quality” of your new contacts is similar to last year, you could hope to hit your goal by getting 4,000 contacts in the top of your recruiting funnel. Increase the top of your funnel by 33% (3000 to 4000) and you can reasonably hope that the bottom of your funnel also increases by 33% (600 to 800).
Note that in this case, the “quality” of a new contact is basically their likelihood of being interested in your school and ultimately enrolling. If you only widen the funnel by accumulating new contacts that are generally less likely to apply and enroll—people who live a long way from your school or otherwise aren’t as likely to be interested—the additional 33% in at the top of the funnel may only turn into a few percent increase at the bottom of the funnel. There are very data-driven ways to measure & predict progression likelihood even at the initial interest stage using machine learning and predictive analytics, so there are ways to know in advance if the 33% you added to the top of the funnel is likely to lead to a full 33% increase at the bottom of the funnel. - Increase the progression rates: in this case we are talking about increasing the application rate (out of total contacts), the admission rate (out of total applicants), and the enrollment (out of total admitted students). Assuming that you don’t want to loosen the selectivity of your school, you cannot focus on increasing the admission rate—unless you identify a process issue which is leading to high quality applicants being denied. So you should focus on increasing the application rate of the contacts you have and on increasing the enrollment rate of those you admit to the school. By doing these things, it is still quite possible to hit our goal even without any widening of the top of the funnel.
In reality, you’ll likely pick a strategy that involves both widening the top of your funnel and increasing progression rates through the admission funnel. The situation of the admissions director reasonably allows for both: an increase in new contacts through marketing, an increase in the application rate through with better communication with prospects, and an increase in the enrollment rate through intensive encouragement and engagement for those who are admitted.
Admittedly, some situations don’t allow both a widening of the top of the funnel and an increase of progression rates. Sometimes our knowledge of the situation tells us it’s unlikely that anything we do will change the progression rates in the process—then we simply need to make the top of our funnel bigger. In other situations like an intervention funnel, our goal is actually defined as a success rate out of the cases assigned to us, so adding more in the top of the funnel isn’t an option. Widening the top of the funnel wouldn’t help help attain a goal that is a percent of assigned cases rather than a number of successful outcomes. In this case, the only solution is to increase progression rates through our funnel.
A bit more (very simple) math
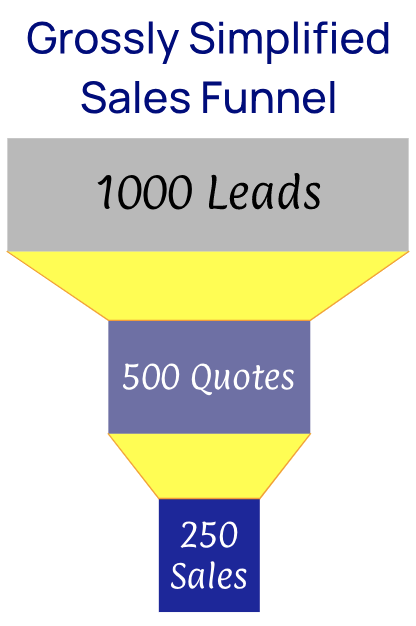
Imagine a highly simplified two-step sales funnel: 1000 leads that turns into 500 quotes which turn into 250 sales. Stop and think for a minute about where you would focus your efforts if your main goal was to increase sales. If you only had the capacity to focus on either (a) turning more leads into quotes or (b) turning more quotes into sales, which would you do? Try to make an instinctive decision on this before you read on.
Okay now for the math: at which stage are we losing more opportunities for a sale? Should that determine where we focus our efforts? Some people might say that the stage where we are losing more opportunities is in the progression of leads to quotes: we lost 500 opportunities here where the lead didn’t ultimately want a quote, and we only lost 250 opportunities between the quote and sale stage where someone who got a quote did not ultimately decide to purchase.
It turns out, though, that this isn’t the best way to think about it. It’s better to think of funnels and stage progression entirely in terms of percents. We had a 50% progression rate from lead to quote, and a 50% progression rate from quote to sale. In this sense, each stage has an identical progression rate. If we find a way to raise either (but not both) of the two progression rates to 60%, we would have the exact same final outcome. Put another way, 50% of 60% of 1000 is the same as 60% of 50% of 1000. This is because 1000 × 0.6 × 0.5 = 300 just as 1000 × 0.5 × 0.6 = 300. If you just had the realization that this is the commutative property of multiplication, your middle-school math teacher would be so very pleased.
Strategic Funnel Strategy
Ultimately, deciding where to focus your efforts on a funnel like this comes down to a strategic process that looks a bit like this example. Of course, each funnel and each business has to fill in the last two columns for themselves and it’ll be different in each situation or industry.
| Stage | Cost/Difficulty of Increasing by 10% | Capacity Implications |
|---|---|---|
| Top of the funnel: total number of leads entering our CRM | Relatively cheap. We have some experience with online advertising and have found it pretty cheap in the past to get more leads via this route. | Our sales team is stretched right now and the job market is tight. If we get lots more leads, we will need to either hire more salespeople or using AI/ML to prioritize the leads most likely to convert. |
| Lead to Quote Progression Rate | More expensive. Our salespeople are already working this list of leads pretty hard to get this number of quotes and we don’t think it’s easy to increase this number. | Again, the sales team is tight right now. Doing this would be labor intensive and we don’t have people with slack in their schedule. Not impossible, bit it would take time and money and waiting to hire and train the right people. |
| Quote to Sale Progression Rate | Possibly pretty cheap? We realize we aren’t doing enough high-touch engagement after the quote and we are just letting them decide on their own if they want to purchase. | There are no labor-intensive downstream steps in the sales funnel after this, so if we increase this rate, it doesn’t create additional work for the sales team. |
After looking at this, most people will come to the conclusion that the easiest and cheapest way to get more sales would be to do more to turn more quotes into sales. A slightly more complex but equally good idea would be to use online advertising to get more leads into the top of the funnel and then to depend on Artificial Intelligence & Machine Learning (AI/ML) to prioritize the leads most likely to convert. This allows us to not hire additional salespeople but instead to focus their efforts on the people most likely to make a purchase. I say “slightly more complex” because it does require some work on the AI/ML front, but the cost of using these advanced technologies is coming down and is entirely within reach for small businesses and nonprofits where it wasn’t as accessible 5-10 years ago.
Funnels Are Your Dashboard
Coming back to the initial thoughts on data-driven operation, operations is about processes and funnels can help us understand processes. Maybe you have a dashboard already for your key operations goals. Maybe you don’t. Either way, perhaps the best way to visualize your dashboard is through a funnel. Why not create (or recreate) your operations dashboard with your key funnels as the organizing principle of your dashboard? The goal of any dashboard should be to know how you’re doing well in advance of a goal or deadline. Wouldn’t you like to know if your sales, recruiting, or intervention pipeline was on track for your goals instead of just waiting for the quarter to end or the recruiting season to close and get the final numbers for how things turned out?
If you want help defining your key operations funnels, ensuring you measure & capture the right stages and progression rates, or creating a live dashboard to know how you’re progressing, United InfoLytics is here to help. Technology and analytics really can help you work smarter instead of simply working harder or hiring more people to continue working in your current paradigm. Let’s set up a time to talk soon and discuss the best ways to define & visualize your funnels. Or let’s talk about using artificial intelligence and machine learning to focus your efforts at each stage in the funnel on those most likely to progress, allowing you to increase progression rates and your final outcomes without hiring additional staff!