In May of 2022 Tennessee’s public-school funding model experienced a seismic shift. Governor Bill Lee signed the “Tennessee Investment in Student Achievement” Act (TISA) establishing a new comprehensive school funding model that replaces the “Basic Education Plan” (BEP) and updating the state’s educational funding rules for the first time in over thirty years.
Schools had a year to prepare their systems and budget expectations for the new TISA world.. The official TISA guide document the state provides is 54 pages long, but the most important shift is the move from what they call a resource-based funding model to a student-based funding model. Where the BEP funding formula was based on complex formulas drawing on assumptions about resources needed for staffing, textbooks, technology, and many other education costs, relative to their location and other unique needs, the TISA system allocates a base dollar amount per student in the state, with a short list of adjustments.
We will quickly outline TISA, the implications for schools, the importance of using multiple matching methods for databases, and finally our advanced AI- and ML-backed fuzzy matching algorithm engineered to go further than off-the-shelf fuzzy matching. The key takeaway here is that fuzzy matching helps when datasets might have some typos or missing data and in this particular case, fuzzy matching can have a huge return on investment in terms of ensuring schools claim all the funding that students are eligible for. Our advanced fuzzy match can almost always more matches than generic fuzzy matching tools.
The TISA Template
The amount of funding a school receives under TISA starts at a base of $7,075 per student. That base number is then adjusted based on a few important criteria:
+5% per student for very small districts
+5% for rural districts with sparse population
+5% for schools in neighborhoods of concentrated poverty
+15-150% based on special learning needs like Dyslexia, English Language Learners, and other special
education classifications
+25% for each student categorized as economically disadvantaged by certain criteria
The TISA system is intended to be simpler and more transparent for schools than the previous BEP program, but there is a high-stakes catch to the new funding model: school funding depends on data quality and accurately capturing all these special student characteristics. In the past incomplete capture of the above characteristics affected the quality of statistical reports and education research, but now it also negatively affects which funding adjustments students qualify for. If a school or district fails to properly capture these student characteristics, this money which is intended to help support students is effectively forfeit.
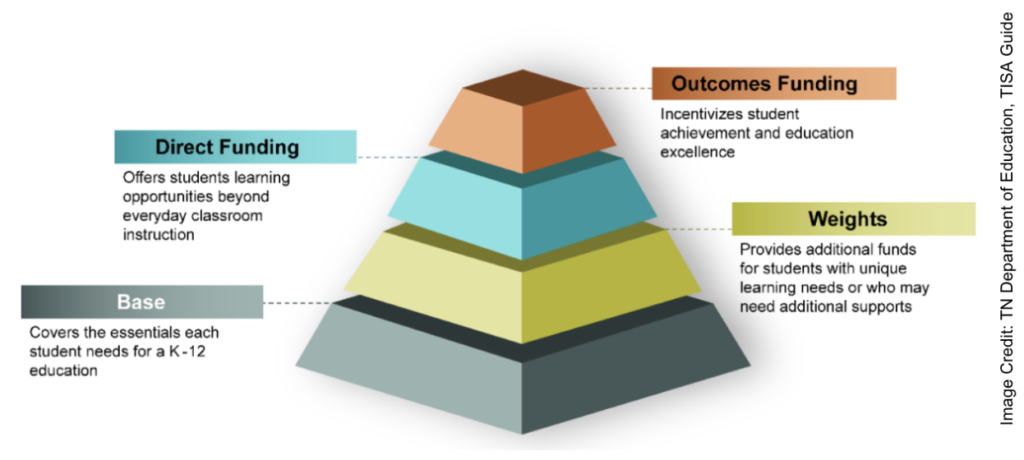
The “weights” segment above is reliant on schools ability to understand the
new law and claim their funding
While several of these classifications are pretty easy to handle by marking all students in a “sparse” district as sparse in the student information system, those which vary student to student require more work. One of the ways that students are classified as economically disadvantaged under the funding formula is if they are “directly certified” as receiving public benefits like SNAP (food assistance) or TANF (cash assistance). Currently the state provides districts with a list of directly certified students for each county and relies on schools and districts to match this list to their student roster marking the matched students as being directly certified in the student information system. Doing this well is not as easy as it might seem.
Typically this task falls to someone in the district or charter school data team—someone who can use excel and run a VLOOKUP to attempt to match students on a key identifier like social security number. If every student’s SSN was known and accurate in both the state DHS/SNAP/TANF database and the school student information system, this would result in 100% of matches found in an hour of work. Unfortunately like all databases there will be inaccuracies and missing data in one or both databases resulting in missed matches. A secondary pass through the databases is warranted and typically this will be done based on matching for exact matches on First Name, Last Name and Date of Birth. In the past the decision on how many different passes and different creative matching attempts to make was left to the data team, but today school and district CFOs, superintendents and leaders need to be involved and helping to ensure that the very best efforts are made—possibly 5 or more different passes with different matching criteria and algorithms.
Each additional student matched results in $1,769 additional funding for the school. It is likely that most schools and districts will under-invest in matching efforts by calling it “good enough” a bit too soon. If a more capable matching algorithm could turn up even a single additional match, the return on investment for this additional effort makes it an easy win to spend the time and effort ensuring as close to 100% of possible matches are found. The reality is that most schools and districts will be turning up 10 or 100 additional matches and making this additional effort pay off tens or hundreds of times over.
The direct certification database includes first and last name, date of birth, address, and Social Security Number. By way of illustration, for a school with about half of students meeting the definition of economic disadvantage, running VLOOKUPs on a variety of different match criteria would typically return the results like these:
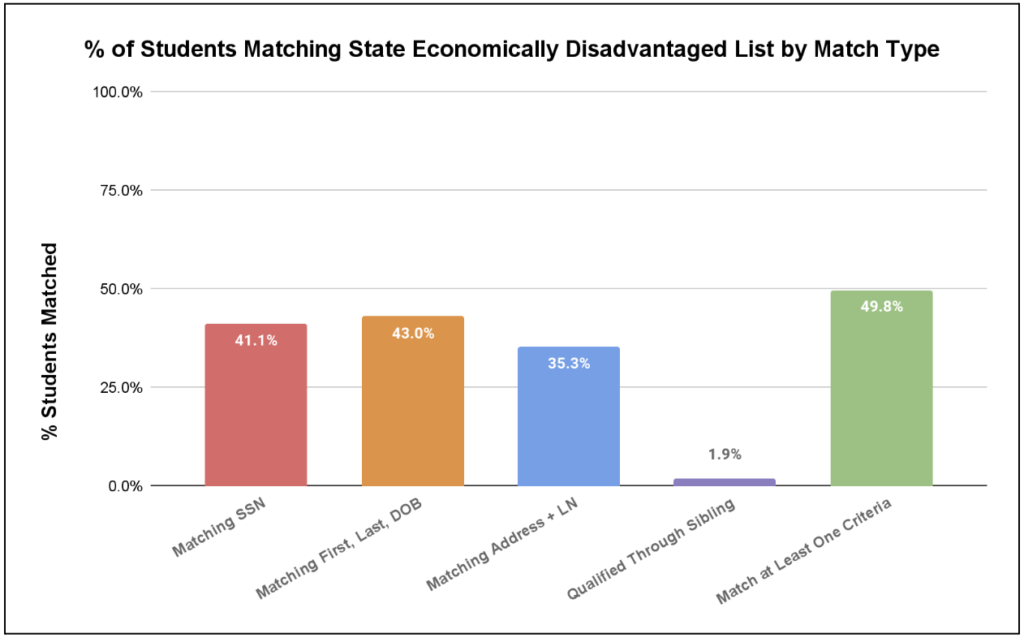
A few students may be found through searching for siblings at other schools who appear on the list
Based on our experience, schools that run one or two of the suggested lookups are likely to catch only 80-85% of the total number of students who are eligible for additional funding. The key column in the above graph is the last one showing that no one match criteria is as good as all of them put together—finding all students that match any of the match criteria.
For a school or district with 1000 students in a moderately disadvantaged area, just doing the extra effort of running 4 or more matching rules instead of 1 matching rule can easily turn into finding 70 additional students who qualify for this additional funding—or $120,000.
The Final Step to 100%: The Power of United InfoLytics’ Custom Matching Solution
By examining multiple matching criteria, more matches will be caught despite the typos and missing data in any database. One final tool remains: we can do even better with the power of “fuzzy” matching! You can imagine a fuzzy match as a tool that “squints” at two datasets, and sees if the shape of any row of entries looks similar to another when you blur your eyes a bit. It is tolerant of multiple types of typos and can match two rows even if there is a typo in almost every column. It can rate potential matches by their likelihood and tell you that the following two people are indeed likely the same person:
John Dow, 10/12/1955, SSN: 123-45-6789, Address: 1488 Main Street, Memphis TN 38122
Jon Doe, 10/12/1995, SSN: 123-54-6789, Address: 1488 Maine Street, Memphis TN 39122
The most user accessible off-the-shelf fuzzy matching tool is the one that can be installed for Excel. There is a learning curve to installing it and using it, but it will pay off in terms of additional matches. That having been said, you can do even better than off-the-shelf fuzzy matching tools when you incorporate deep matches with AI and machine learning to calibrate and evaluate even distant possible matches. This is where our custom solution comes in.
United InfoLytics Can Help
We would love to help ensure that you get as close to 100% of the real matches as possible, and our custom AI-backed fuzzy matching tool specifically engineered for DHS to SIS matching is the only tool that consistently outperforms other fuzzy match tools and is purpose-built for the task. We’ve spent over a year iterating on this and we’ve had several breakthroughs over this time that unlock an additional tenth of a percent or half of a percent of additional matches. Now that we believe we’ve engineered a best in class algorithm and software solution for this particular high-stakes funding need that districts have, we are offering it to any district that wants to find what their current matching efforts are missing. We’ve priced it aggressively and fairly: you only pay for what we find and the cost decreases as we find more students. After signing an NDA and a few minutes of your time to share your data with us, we will offer a free scan to tell you approximately how many students we will be able to find for you earn more. Learn more about this service here.